Guides
Average Lawn Size by State: The 2026 Reference
US average lawn sizes vary roughly tenfold between the smallest and largest states. Here's the 2026 reference — the state-pattern map, the four factors that drive it, and what lawn size actually means for ADU planning, water cost, and housing comparisons.
On this page
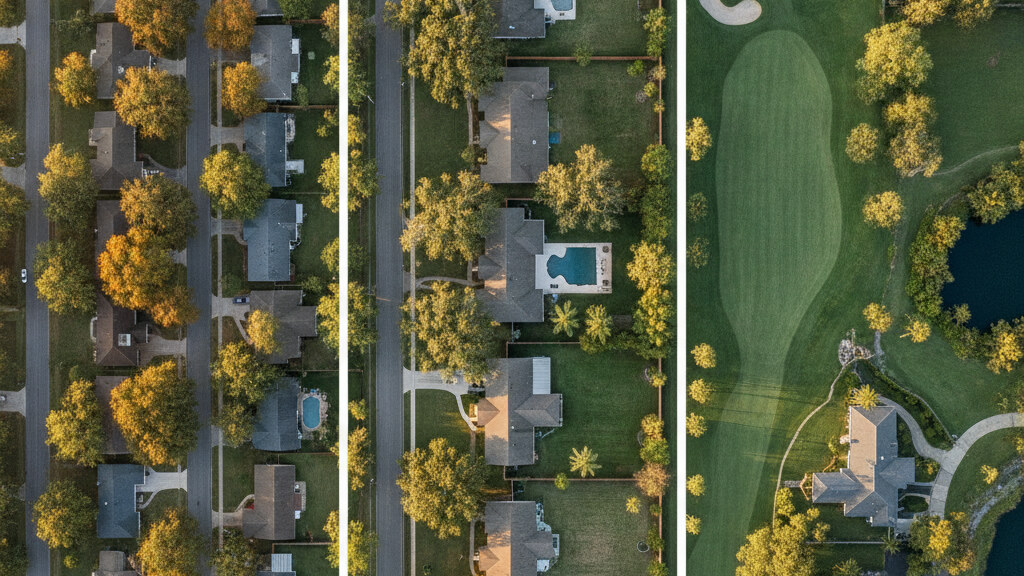
Lawn size varies more across US states than most national averages suggest. The same phrase — "average lawn" — describes a fenced rectangle behind a Northeast row house, a flat expanse around a Sunbelt single-family on a quarter-acre, a sloped front-and-back combination around a Midwestern mid-century, and a multi-acre meadow around a rural property in the Mountain West or the South. The state-by-state pattern is shaped by lot size, climate, water availability, regional building tradition, and the dominant era of subdivision development. The 2026 ranges worth knowing are not a single national average but a state-pattern map that explains why your neighbor in another state has a yard that looks nothing like yours.
If you are asking how the average lawn size varies by state, the underlying question is usually about water cost, maintenance time, ADU or addition planning, or comparing housing markets — and the state pattern matters for each of those.
What Drives the State Pattern
Four factors explain most of the state-by-state variation in average lawn size.
The first is the era of dominant subdivision development. States where most housing stock was built between 1950 and 1990 — much of the Sunbelt, much of the Midwest — tend to have larger lots and larger lawns than states where most housing stock was built before 1950 (much of New England, the Northeast urban core) or after 2010 (newer Mountain West and South).
The second is land cost per square foot. States with high land cost — California, Hawaii, Massachusetts, much of New York and New Jersey — produce subdivisions designed for higher residential density and smaller individual lawns. States with low land cost — most of the South, the Mountain West outside metro areas — produce subdivisions designed for larger individual lots and larger lawns.
The third is climate and water availability. States where lawn irrigation is mandatory most of the year (much of the Southwest, parts of California) have produced housing markets where smaller lawns or lawn-alternative landscapes are increasingly common. States with reliable rainfall (the Southeast, the Pacific Northwest, the Midwest) have maintained larger-lawn cultures more consistently.
The fourth is rural-versus-metro composition. States with a high share of population in rural and exurban areas (West Virginia, Mississippi, much of Appalachia, much of the Plains) have higher average lawn sizes than states where population concentrates in dense metro areas (New York, Massachusetts, New Jersey).
The State-Pattern Map, 2026
Smallest-Lawn States
Approximately 1,500 to 3,500 square feet of typical lawn area on the median single-family parcel.
Massachusetts, Rhode Island, Connecticut, New Jersey, Maryland, and parts of urban Pennsylvania share dense Mid-Atlantic and New England land-use patterns. Much of the housing stock is older, lot sizes were established before mid-century suburbanization, and the dominant housing forms include row houses and small-lot detached single-family. The result is consistently smaller lawn areas across the state.
The District of Columbia, treated separately for housing statistics, has the smallest average lawn area in any US jurisdiction.
Hawaii and the densest portions of California — particularly the San Francisco Bay Area and central coastal markets — also fall into this range due to extreme land cost.
Mid-Range Lawn States
Approximately 3,500 to 6,500 square feet of typical lawn area.
Most of the inland Mid-Atlantic and Mid-South — Virginia, North Carolina, parts of South Carolina, Georgia outside Atlanta, parts of Tennessee — fits this range. Subdivision development from the 1950s through 1990s established lot patterns that produced this lawn range as the dominant pattern.
The non-rural portions of Ohio, Indiana, Illinois, and Michigan also fit this range, with significant intrastate variation between dense metro cores and the outer suburban ring.
Larger-Lawn States
Approximately 6,500 to 15,000 square feet of typical lawn area on the median single-family parcel.
Texas (statewide median is large despite dense urban cores), Florida (despite dense coastal markets), Georgia (driven by exurban Atlanta and rural areas), most of the Southeast outside dense coastal markets, much of the Midwest outside the major metros, the inland West, and the more rural portions of the Mountain West.
The state-level pattern here is heavily influenced by the inclusion of rural and exurban parcels in the median calculation. Metro-area medians within these states can be meaningfully smaller than the statewide median.
Acreage-Norm States
Median lawn area meaningfully exceeding 15,000 square feet, often measured in fractions of an acre rather than square footage.
West Virginia, Mississippi, much of Alabama outside Birmingham and Mobile, Vermont and rural New Hampshire (despite the dense Mid-Atlantic pattern of the rest of New England), Wyoming, Montana, North Dakota, South Dakota, much of Nebraska and Kansas, and rural portions of most other states.
In these states, lawn area is often less meaningful than acreage as a unit of measurement. A typical single-family parcel may sit on 1 to 5 acres rather than the fractional-acre lots typical of metro-area subdivisions.
How to Find Your State's Actual Number
Three approaches produce a usable estimate for any specific state.
The first is the US Census Bureau American Housing Survey, which publishes data on housing characteristics including lot size by metropolitan area and state. The lot size statistics, while not directly equivalent to lawn area, provide a workable proxy when combined with average building footprint data.
The second is real estate analytics published by major brokerages and analytics firms. Zillow and similar platforms publish lot size statistics by ZIP code and state that can be aggregated for state-level estimates.
The third is direct measurement from county parcel data. Most US counties publish parcel records with recorded lot dimensions; aggregating these for a representative sample produces a defensible state-level estimate.
When you see a single national or state-level "average lawn size" figure cited without methodology, treat it skeptically. The right figure depends on how the source defined lawn area, what property types were included, and whether the calculation was mean or median.
The Mean Versus Median Distinction
The mean (arithmetic average) and the median (middle value) produce meaningfully different figures for lawn size, particularly in states with high variance between dense metro and rural acreage parcels.
A state where most population lives in dense metro areas but where many rural acreage parcels exist will have a mean lawn size dramatically larger than its median lawn size. Texas, California, Florida, and several other large-population states share this pattern.
For housing comparisons and ADU planning, the median is typically the more useful figure because it represents the typical single-family parcel rather than being skewed by a small number of very-large rural parcels.
What Lawn Size Means for Different Decisions
The state-by-state lawn pattern matters for several specific decision categories.
For ADU planning, the relevant question is whether the typical median single-family parcel in a state has sufficient usable rear yard area to support a meaningful detached ADU. In smaller-lawn states, ADU configurations more often involve interior conversions, garage conversions, or basement units. In larger-lawn states, detached new-build ADUs are typically workable on most median single-family parcels.
For water cost planning, larger lawns in arid or semi-arid states (Arizona, Nevada, much of California, parts of Texas, Colorado) carry meaningful ongoing water and irrigation cost. Smaller lawns or lawn-alternative landscapes reduce that ongoing cost.
For housing-market comparisons, the lawn size pattern is one component of the larger pattern of housing density and lot configuration that differentiates markets. A buyer relocating from Massachusetts to Texas often experiences the lawn size shift as one of the more visible aspects of the housing-pattern difference.
For maintenance planning, larger lawns require correspondingly larger maintenance equipment, longer maintenance time, and (in many markets) larger landscape service expense.
The PERCH Take
The work PERCH was built for — surfacing verified factories, builders, and concierge support for modular, manufactured, prefab, and ADU buyers — sits squarely in the planning context where backyard, lawn, and lot dimensions matter for what is actually buildable on a specific parcel. The state-pattern map is useful context for relocation, comparison, and high-level planning. The parcel-specific evaluation is what determines whether a specific addition is workable on a specific lot in 2026.
The PERCH verified ADU builder directory covers all 50 states plus DC and Puerto Rico, with state-specific configuration norms and verified builders for each market.
Ready to evaluate what your specific parcel supports? Join the PERCH waitlist → for early access to verified state-by-state ADU planning support.
Join the conversation
Comments
Reader questions get answered. Real names and a working email — that's it.